Your documents know more than you can read.
Most institutional knowledge is locked inside PDFs, scanned reports, and spreadsheets, unreadable at scale. We build AI pipelines that extract, structure, score, and visualise that data so decisions stop depending on who had time to read the file.
Raw ingest
Scanned PDFs, balance sheets, sensor CSVs, image uploads, any format, any language.
AI extraction
Gemini OCR reads unstructured documents and pulls structured fields (figures, names, dates, categories) with 99%+ confidence scoring.
Logic & scoring
Extracted data feeds algorithmic engines (financial ratios, Altman Z-Score, anomaly detection, carbon calculations) run automatically.
Intelligence layer
Results surface as interactive dashboards, geospatial heatmaps, AI chat, and exportable reports, ready for decisions.
Three things we turn unstructured data into.
From raw documents to business intelligence, the same pipeline, adapted to your data type and decision context.
AI document extraction
Gemini-powered OCR that reads PDFs and scanned images in any language (Greek, English, multi-column financials) and pulls structured data with confidence scoring. No templates, no manual mapping.
Financial health scoring
Extracted figures feed algorithmic engines (liquidity ratios, profitability, leverage, Altman Z-Score) automatically classifying entities as Healthy, Watch, or Distressed. Across hundreds of companies simultaneously.
Geospatial intelligence
Financial and operational data plotted on interactive Leaflet maps, clustered markers, heatmap overlays, hot-zone detection, and regional filtering. Economic activity made visible at street level.
Nine ratios. Automatic classification. Across your entire portfolio.
Instead of reading balance sheets one by one, our scoring engine processes all of them simultaneously, surfacing the outliers that need attention and the performers worth knowing about.
From PDF to portfolio view, automatically.
Upload a batch of balance sheets. The pipeline reads each one with Gemini OCR, extracts the figures, computes all nine ratios, runs the Altman Z-Score, and classifies every entity, in seconds, not days.
Results are queryable: filter by region, sector, or classification. Drill into any company’s breakdown. Export for reporting. Ask the AI in plain language what the data means.
Company A · Retail, Thessaloniki
CASH KINGStrong liquidity, low leverage, consistent profitability over 3 years. No flags across 9 ratios.
Company B · Manufacturing, Larissa
DISTRESSEDDebt-to-equity at 3.4×, current ratio below 1.0, declining margins for 2 years. Flagged for review.
Data doesn’t exist in a spreadsheet. It exists in a location.
Financial and operational data plotted on interactive maps, revealing geographic patterns, regional concentrations, and economic hot zones that rows and columns hide.
Hot-zone detection
Heatmap overlays and clustered markers reveal where economic activity is concentrated (by turnover, profitability, or sector) at postcode or street level.
Dynamic filtering
Filter the map by sector, financial classification, region, or time period. Results update instantly without page reloads.
Drill-down detail
Click any marker to see the entity’s full financial profile (all nine ratios, scoring history, and extracted source data) without leaving the map.
Export-ready output
Every view (filtered, zoomed, or selected) can be exported as PDF or Excel for reports, presentations, or further analysis.
Built for a chamber of commerce. Running in production.
Financial intelligence across 1,000+ member companies
BalanceIQ is Nexus OMAS, adapted for the Chamber of Commerce of Larissa, its agents repurposed to read Greek financial PDFs, compute nine ratios for every member company, classify health, plot results geospatially, and answer questions in natural Greek.
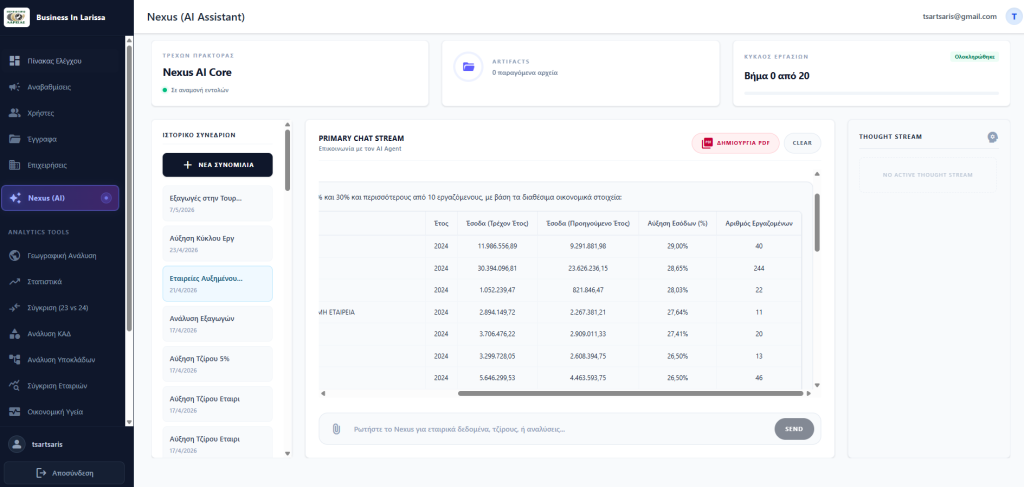
Greek PDF extraction
Gemini OCR reads scanned Greek balance sheets and extracts structured financial figures (turnover, assets, liabilities, equity) with confidence scoring on every field.
Automatic health classification
Nine ratios computed per company: liquidity, leverage, profitability, efficiency. Altman Z-Score classifies each entity as Cash King, Healthy, Watch, or Distressed.
Ask the data in Greek
Chamber staff ask questions in natural Greek (“which companies in the food sector are financially distressed?”) and get cited answers from the financial database.
Data intelligence that also answers questions and takes action.
Once your data is structured and scored, Nexus AI Agents turn it into a conversational interface, staff ask questions in plain language and get answers from the data, with citations.
Explore Nexus AI Agents →Ask “which of our clients showed declining margins last year?” and get an answer from the data, not a search result.
Every AI response is pinned to the source document and field, so the answer is auditable, not just useful.
A live thought stream shows which agents ran, what they retrieved, and how they reached the answer, full transparency.
Your data, extracted, scored, and protected.
AI pipelines process sensitive financial documents. Every system we build treats data security and regulatory accountability as structural requirements, not afterthoughts.
Data isolation
Every organisation’s extracted data lives in its own isolated scope, no cross-contamination between tenants.
GDPR compliance
Financial document processing is handled under EU data-protection principles, with full audit trails on every extraction.
Confidence scoring
Every extracted field carries a confidence score, low-confidence values are flagged for human review before they enter scoring.
EU-hosted infrastructure
Processing and storage on Google Cloud infrastructure within EU jurisdiction. Your documents don’t leave Europe.
Tell us what’s locked inside your documents. We’ll show you how to unlock it.
Thirty minutes. Bring your data challenge: PDFs, reports, sensor feeds, spreadsheets, and we’ll map the extraction, scoring, and visualisation pipeline that fits it.
Book a discovery call